“People don’t click ads on Facebook”
”You can’t sell expensive stuff on Facebook”
“All people want to do is watch cat videos on social media. They won’t buy anything.”
What if I told you that we sell $3000-11,000 home service projects each and every week with Facebook advertising…with a 24.5x return on advertising spend?
Here’s what I mean: we spent $4,684.73 for one of our clients and generated over $115,000 in new revenue in the same month.
The Challenge
The client is based out of Columbus, Ohio and initially approached Amplifii with an opportunity. Leads were being generated with offline marketing and a call center, but they were looking to diversify their lead generation and test a new channel.
The channel they wanted to test: Facebook advertising.
This is a home renovation company, where the average transaction is $3,000-$11,000.
There were a lot of variables that made this campaign difficult for us to execute:
- No experience with Facebook ads campaign. This means there is no foundation for graphics or copywriting that has worked well in the past.
- No existing marketing funnel. There is no data on steps to best convert a click into a lead into a client.
- No benchmarks. There is no foundation of data to optimize and scale.
- No one to model off. Their offer is a unique offer in the marketplace, so there was no obvious companies to model.
- Sales cycles are long (60-90 days is normal). Theoretically, it would take a long time to convert a lead into a client.
We are obsessed with challenging ourselves at Amplifii.
We love challenges.
Bring it on!
The Process
Decide on a powerful offer
The underlying requirement of a successful campaign is a powerful offer on the front end (what prospects see on Facebook) and on the backend (over the phone and in person, in this case).
We were able to formulate an offer that was attention grabbing and was able to get them click the ad.
Define a breakeven campaign
Most entrepreneurs know what a failing campaign looks like (we spent more money than we made); that’s easy. But what has to happen for you to breakeven? More importantly, what needs to happen for you to actually make money?
The first objective for SJS was to get clarity on benchmarks on the existing campaign. Amplfii launched the campaign to collect data on performance metrics for the KPIs. We looked at what was going on at the Facebook level as phase 1.
The metrics we were looking for here include:
- Number of clicks
- Cost per website click
- Number of leads
- Landing page conversion rate
- Cost per lead

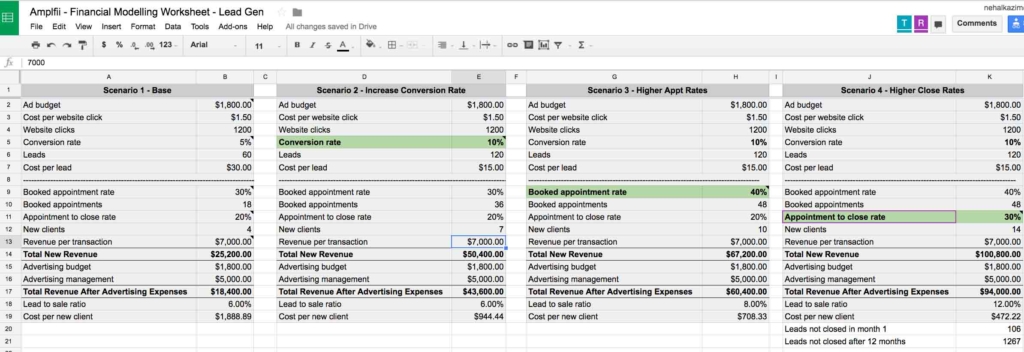
Click here to get a financial modelling worksheet
Define the funnel pages needed
We know the deliverables for each step of the process. Here is what our funnel looks like and the assets required for each step:
- Facebook ad: copy and images – 6 variations (cold traffic and retargeting)
- Landing page w/survey: copy for page + survey questions + technical setup
- Book an appointment page: copy for page + technical setup + calendar integration
- What to expect next: copy for page + technical setup
Month 1: Launch first round of ads
You know when you are so excited to launch a campaign, you can’t wait to get it in front of prospects who are ready to give you money, see leads flying in, see money coming in from Facebook traffic and giving each other high fives?
Well, that didn’t happen.
We couldn’t get a lead if our lives depended on it.
Here’s what happened:
- The audience targeting was incorrect
- Cost per click was too high
- Landing page didn’t convert
- We couldn’t get a lead if our lives depended on it
But we didn’t give up!
To fix the campaign, here’s what we did next:
- Facebook ad: created new images
- Facebook ad: created new copy
- Facebook ad: tested new targeting + ad objectives
- Facebook ad: designed + launched retargeting ads
- Landing page: created a new landing page test
- Landing page: adjusted the survey page into a two-step survey
- Appointment page: simplified copy

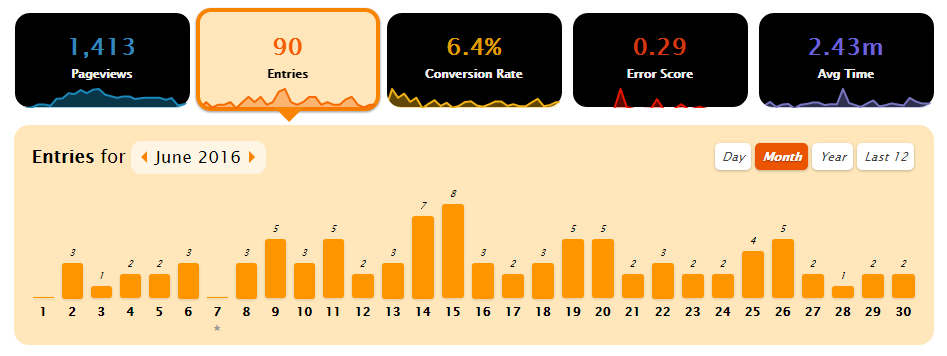
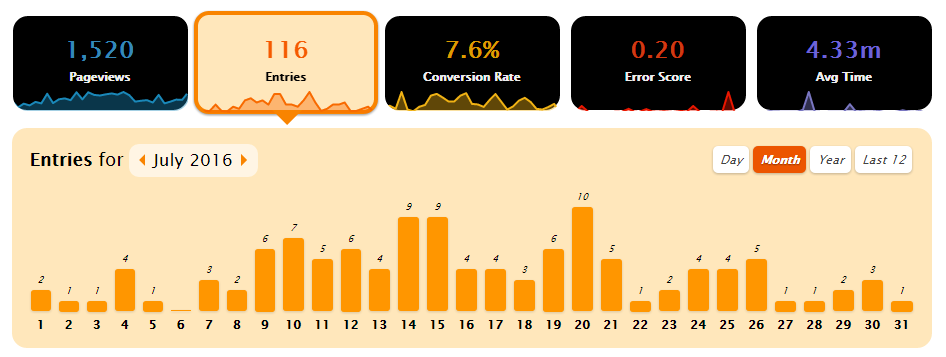
The campaign went from generating 0 leads, to trickling in with one lead here or there. THEN, we started getting 2-5 leads per day!
That whole process of getting 0 leads to getting 1 lead took about a week.
Then, to get 1-2 leads consistently took another 4 days.
And finally, to get 2-5 leads per day took another week.
We went from not knowing what offer would work in a local market to generating leads consistently and predictably within the first month!
month 2: things got better

We started getting into a groove!
When things start working, that’s the time to strike and push the campaign to its limits.
Here are the optimizations we made:
- Increased the daily ad budget
- Broke down the ad spend into high volume of small ad sets
- Launched the first lookalike audience
- Optimized cold ad images
- Developed video ads
- Launched video ads
We are also paranoid, because we know that campaigns can die at any time. So here’s what we did:
- Created back up copy
- Created back up video ads
- Developed another variation of the landing page to test
- Craft a list of tests to run in the internal test log
The Outcome
To say the client was ecstatic would be an understatement.
To reiterate, there were a lot of reasons this campaign could fail:
- No experience with Facebook ads campaign. This means there is no foundation for graphics or copywriting that has worked well in the past.
- No existing marketing funnel. There is no data on steps to best convert a click into a lead into a client.
- No benchmarks. There is no foundation of data to optimize and scale.
- No one to model off. Their offer is a unique offer in the marketplace, so there was no obvious companies to model.
- Sales cycles are long (60-90 days is normal). Theoretically, it would take a long time to convert a lead into a client.
After just two months on working with this client, Amplifii was able to:
- Generated 133 leads
- CPL was $35.22
- Close at 13% (1/8) leads buy
- 16 closes per month
- Therefore, CPA for a sale was $563.52
- Average transaction was approximately $7000+
This is the bottom line:
$4,684.73
Spent
$115,000
Revenue Generated
24.5x
Return on Investment